Tuesday, April 21, 2009

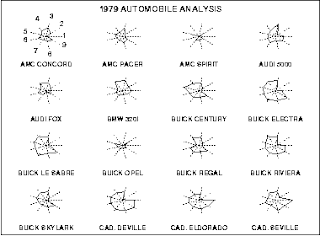
Star Plots


This is a Star Plot denoting cars and their variables. Star plots are a graphical data analysis method used for deciphering behavior of variables in a data set. They consist of equiangular spoke, or radii, that represents a variable. Lines are drawn connecting the data giving it the star appearance. 

Found At: http://www.itl.nist.gov/div898/handbook/eda/section3/starplot.htm

Correlation Matrix


This is a Correlation Matrix of protein correlation. The correlated behavior ranges from the reds to blue in a triangular process. These matrixes lists variable down one column and across the first row. It indicates the strength and direction of a linear relationship between two random variables.

Found At: http://yin.che.wisc.edu/images.htm

Similarity Matrix


This is a Similarity Matrix showing scores that decipher similarities between tow data points. They are typically used in a sequence alignment and the higher the score results in the more similar characters it denotes.

Found At: http://tomcat.esat.kuleuven.be/txtgate/tutorial.jsp

Stem and Leaf Plot


This is a Stem and Leaf Plot depicting the GNP of Western African nations. Graphs like this are used to show quantitative data in graphical form to help people visualize the distribution among the categories. 

Found At: http://mainland.cctt.org/mathsummer/JosephBond/StemAndPlots/stem-and-leaf_std.htm

Box Plot


This is a Box Plot used to portray numerical data groups through number summaries. They can be used to portray differences in population without making statistical distribution assumptions. 

Found At: http://support.sas.com/rnd/base/topics/statgraph/proctemplate/images/boxplot.gif

Parallel Coordinate Graph


This is a Parallel Coordinate Graph representing multivariate relations denoting specific properties of the relationship corresponding to the geometric representation of the graph. 

Found At: http://raffy.ch/blog/2007/03/

Triangular Plot


This is a Triangular Plot of conservative, liberal and labour votes. This is data from the UK in 2005 and the dot represents the percentage of votes based on polls. These graphs portray three sets of data. The three variable are easy to represent in a triangular fashion. 

Found At: http://www.ex-parrot.com/~chris/wwwitter/20050407-it_doesnt_matter_how_you_vote_either_way_your_planet_is_doomed.html

Windrose


This is a Windrose graph for Seattle, Washington with the most common wind direction heading south. These graphs represent wind speed and direction in vector form. Depending on the vectors length, one can determine frequency of the winds speed and direction. Color represents the speed of the wind denoted in knots. 

Found At: http://www.climate.washington.edu/windrose/Seattle-WindRose.jpg

Climograph


This is a Climograph for Rwanda from January to December. This graph measures precipitation in inches. Climographs show how precipitation and temperature correspond during different times of the year in specified regions. Precipitation is shown by the bar graph and a line graph depicts temperature.

Found At: https://africawiki.wikispaces.com/file/view/climograph.png

Population Profile


This is a Population Profile depicting the percentage of the male/female population in each age division for Mobile County during the 1998 census.  Light blue is female an dark blue is male. population profiles are often found in the form of a population pyramid and can display things such as age and sex populations for any given area. 

Found At: http://images.google.com/imgres?imgurl=http://camellia.shc.edu/literacy/tablesversion/assignments/Image2.jpg&imgrefurl=http://camellia.shc.edu/literacy/tablesversion/assignments/statisticsassign.htm&usg=__UQPIlMRDWuMw1D6CYwA93DsfEs4=&h=1568&w=1191&sz=169&hl=en&start=1&um=1&tbnid=x09kvrrl1LjMrM:&tbnh=150&tbnw=114&prev=/images%3Fq%3Dpopulation%2Bprofile%2Bmobile%26hl%3Den%26client%3Dsafari%26rls%3Den-us%26sa%3DN%26um%3D1

Index Value Plot


This is an Index Value Plot showing the average stream flow is plotted according to days of the week with the value comparison at 4 from February to March in North Carolina.  Index value plots is where an index value is plotted rather than a number. It gives a comparison so as to base the values off of. The maps show discrepancies between data. 

Found At: http://water.usgs.gov/waterwatch/?m=real&r=nc&w=real%2Cplot

Accumulative Line Graph or Lorenz Curve


This is an Accumulative Line Graph or Lorenz Curve illustrating inequality and income. Lorenz curves graphically display probability distribution. Straight lines shows the values if X and Y were proportional, and the curve shows actually distribution that is not equal. 

Found At: http://ingrimayne.com/econ/AllocatingRationing/Figure6.5.gif

Bilateral Graph


This is a Bilateral Graph of humanitarian services in different countries. Bilateral graphs depict the increases on one side of a zero line and the decreases on the other side or underneath. They are a visualization graph the show two relatable variable whose trends are moving in opposite directions. Data in these graphs are displayed in both positive and negative values. 

Found At: http://www.globalhumanitarianassistance.org/humanitarian%20assistance%20donors.htm

Nominal Area Choropleth Map


This is a Nominal Area Choropleth Map. This map has two divisions as the colors represent the variations in data. This map depicts the political party selections per state from poor voters. Blue are democrats and red are republicans. These maps depict nominal data meaning data that is quantitative and random. 

Found At: http://www.stat.columbia.edu/~cook/movabletype/archives/2007/10/some_cool_graph.html

Unstandardized Choropleth Map


This is an Unstandardized Choropleth Map of hazardous waste installations per state in 1997. These numbers are raw and is broken into 6 step intervals. The legend at the bottom indicates different colors for waste sites. These maps deal with un-averaged data in numerical values. 

Found At: http://www.okstate.edu/sas/v7/sashtml/books/graph/images/01215109.gif

Standardized Choropleth Maps


This is a Standardized Choropleth Map with averaged data from the 2006 census. This map is both standard and classed showing the percentage of Canada's population under the age of 14. These maps can be presented in percentages or densities and allow comparisons of data among different areas. 

Found At: http://www.statcan.gc.ca/pub/92f0138m/2008003/figures/5200001-eng.htm

Classed Choropleth Map


This is a Classed Choropleth Map of North Carolina for Public Education. It depicts the amount of dollars spent per student between 1994-1995. Classed Choropleth Maps use smaller intervals to portray the data shown. It uses a particular scale and color intervals. This map has five intervals with colors ranging from light yellow to dark green. 

Range Graded Proportional Circle Map


This is a Range Graded Proportional Circle Map. These maps depict different sized circles in relation to the range and amount of data.  

Found At: http://pubs.usgs.gov/fs/fs-004-03/

Continuously Variable Proportional Circle Map


This is a Continuous Variable Proportional Circle Map of Western Germany. These maps create point data and forms scales to that data using circles.  The circles are in proportion to the data being analyzed and measured. 

Found At: http://www.lib.utexas.edu/maps/europe/west_germany_ind_1972.jpg

Isopach


This is an Isopach Map of Holocene Overburden. The contours (rainbow colors) correspond to the thickness of the sediment on the ocean floor. The pink colors denote higher sediment concentration. Isopach maps represent thickness and variation of a stratigraphic unit. 

Found At: http://seeps.geol.ucsb.edu/pages/isopach.html

Isotachs


This is an Isotach of the Southeastern United Sates. Isotachs are lines that connect equal wind speed points. They are sometimes seen in conjunction with Isobars.  

Found At: http://weather.cod.edu/help/700tach.gif

Cartographic Animation


This is a Cartographic Animation of Hurricane Katrina in 2005 near New Orleans. Cartographic animation is useful for representing geographical area's. These animations shows relationships between geospatial data components, time, location and attribute and are most widely used to represent geospatial information. It supposed to help you visualize something in the maps not apparent if seen individually. 

Cartogram


This is a Cartogram of the 2004 presidential election depicting population in regards to red and blue sates (republican to democrat). The country was obviously divided between Kerry and Bush. Cartograms come in area and distance and do not accurately preserve or portray area. They are often used to represents population size to a given area.  

Found At: http://www.redstatevoices.com/resources/%7Emejn/election/body_index.htm

Choropleth Map


This is a Choropleth Map of Florida depicting the percentage of Hispanic people by county. Based on the 2000 census, it clearly shows that South Florida has an overwhelmingly larger population of Hispanic people than central and northern Florida. Choropleth maps are thematic maps with areas shaded in reference to the statistic being evaluated. 


Found At: http://my.ilstu.edu/%7Ejrcarter/Geo204/Choro/Tom/


Monday, April 20, 2009

Scatterplot


This is a Scatterplot representing  heart disease in correlation to age. Scatterplots use Cartesian coordinates to values for specific valuable from data at hand. Value is determined by the position of data on the horizontal and vertical axis. 

Found At: http://www.ailab.si/janez/visualizations.html

Isopleth


The map is an Isopleth map representing the Hydrogen Ion concentration with the most in the west and least in the northeast. Isopleth maps generalize data into a continuous distribution.These maps are typically used for surface elevations, precipitation, pressure and other measurable elements. These maps are viewed in the third dimension. 

Found At: http://nadp.sws.uiuc.edu/isopleths/maps2003/

Isohyets


This is a map of Isohyets, or Isohyetal map, showing rainfall in the Taranaki Region in August 2008. The contours on this map join equal areas of precipitation. 

Found At: http://www.scoop.co.nz/stories/AK0808/S00090.htm

Isobars


This is an Isobar Map of European and Mediterranean barometric pressure. Isobars are the lines on the map that connect the areas of equal pressure. These are most widely used for weather maps and purposes. 

Found At: http://german.about.com/library/bldwetter_iso01.htm

LIDAR


This is a LIDAR of Manhattan. Also meaning Light Detection and Ranging, it is an optical remote sensing tool that measures light to find the range of an object or anything else thats at a distance. LIDAR uses shorter wavelengths and is similar to infrared.  

Found At: http://www.icrest.missouri.edu/Sensors/lidar.htm

Flow Map


This is a Flow Map of European traffic flow. The red lines denote the flow and the thickness of the red lines denote the volume of the flow. The bigger the circles denotes more traffic flow for outgoing traffic. Flow maps typically show the movement of people or things from one location to another, such as migration. 

Fount At: http://mundi.net/maps/maps_014/

Isoline Map


This is an Isoline Map of Antarctica. It is being used to represent geoid height. Isoline maps are two dimensional representations contained within a three dimensional model. These maps can representation variations in data with continuous lines of the same value. 

Found At: http://www.scar.org/publications/reports/20/Rep20a.html

Proportional Circle Map


This is a Proportional Circle Map denoting internet users in Europe. These maps display data in relation the the circle size. 

Found At: http://jeffhobbs.files.wordpress.com/2008/03/1.gif

Dot Distribution Map


This is a Dot Distribution Map of the distribution of military families in Ohio. These maps typically are helpful in determining population size and location. In this map, these military families live in every country throughout Ohio. 

Found At: http://operationmilitarykids.ohio4h.org/resources/bycounty.html

Propaganda Map


This is a Propaganda Map of Europe circa 1914. Propaganda maps are well know for their use in WWI and WWII, as I suspect that this map was used for exactly that purpose. These maps are made to persuade people to think a certain opinion, position or to even get people to do something. 

Found At: http://www.victoriansatwar.net/archives/maps_2.html

PLSS Map


This is a PLSS Map of Alabama. PLSS stands for Public Land Survey System. This map shows townships with Franklin County Townships in blue. PLSS maps divide up public land that is owned by the government and the grid lines here represent land ownership. 

Found At: http://www.rootsweb.ancestry.com/%7Ealfrankl/land.html

Mental Map


This is a Mental Map of the Nottingham City Centre in 1997. Mental maps deal with peoples points of views and are often referred to as visual displays.  They show what's going on inside someone's head and offer insight to how one person views something specific regarding size, direction etc.It shows the uniqueness of a given place, according to a person and no map can be like another as everybody sees things at least a little differently.  These maps draw heavily on the opinion of the cartographer. We all make mental maps. 

Found At: http://www.fedstats.gov/kids/mapstats/concepts_mentalmaps.html

Infrared Ariel Photo


This is an Infrared Ariel Photo of the Mississippi River showing the main navigation channel to the left and the adjacent secondary channel to the right. Infrared Photos are typically used to detect certain spectrum of light. It is used to note changes in the environment and track different qualities of a given area. This photo is part of an ongoing effort to assess the consequences of human fishing services and its affect on the given area as well as the marine life. 

Found At: http://www.umesc.usgs.gov/aquatic/deep_channels.html

Cadastral Map


This is a Cadastral Map of Delaware County, Ohio. Cadastral maps display very accurate descriptions of pieces of land. Names or numbers are typically assigned to specific areas to identify the land mass or property. Scale is very important when working with Cadastral Maps so to attain accurate identification and representations of the land.

Found At: http://www.dalisproject.org/(S(jxcgu2yrhwvujw45gfcodd55))/pages/findMapsheet.aspx

Topographic Map


This is a Topographic Map of Stowe, Vermont. Topographic Maps generally use contour lines to represent relief in maps such as the example here. Topographic Maps are used to show landscape and geographic feature variations in a given area. 

Found At: https://www1.nga.mil/PRODUCTSSERVICES/TOPOGRAPHICALTERRESTRIAL/Pages/default.aspx

Doppler Radar Map


This is a Doppler Radar map of the New England area taken in January of 2001. Doppler Radar uses the Doppler affect to  measure radial velocity through returned echoes from different objects. Kind of like sonar. These maps can be used for various reasons including air traffic control, military and air force defense as well as speed guns used by the police.   

Found At: http://www.xenodochy.org/diogenes/weather.html

Black and White Aerial Photo Map


This is a Black and White ariel photo of I-95 and I-695 from 20,000 foot altitude. It was taken in February of 1998 in Boston, Massachusetts. Black and white photos give people a very visual, accurate and unique perspective on a given area. 

Found At: http://www.math.toronto.edu/%7Edrorbn/Gallery/KnottedObjects/Interchange/