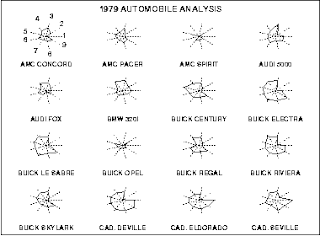
This is a Star Plot denoting cars and their variables. Star plots are a graphical data analysis method used for deciphering behavior of variables in a data set. They consist of equiangular spoke, or radii, that represents a variable. Lines are drawn connecting the data giving it the star appearance.
Found At: http://www.itl.nist.gov/div898/handbook/eda/section3/starplot.htm

No comments:
Post a Comment